You can download this .qmd file from here. Just hit the Download Raw File button.
Code style
We are going to take a timeout at this point to focus a little on code quality. Chapter 4 in R4DS provides a nice introduction to code style and why it’s important. As they do in that chapter, we will follow the tidyverse style guide in this class.
Based on those resources, can you improve this poorly styled code chunk using the data from our DS1 Review activity?
library(tidyverse)
── Attaching core tidyverse packages ──────────────────────── tidyverse 2.0.0 ──
✔ dplyr     1.1.4     ✔ readr     2.1.5
✔ forcats   1.0.0     ✔ stringr   1.5.1
✔ ggplot2   3.5.1     ✔ tibble    3.2.1
✔ lubridate 1.9.4     ✔ tidyr     1.3.1
✔ purrr     1.0.2
── Conflicts ────────────────────────────────────────── tidyverse_conflicts() ──
✖ dplyr::filter() masks stats::filter()
✖ dplyr::lag()    masks stats::lag()
ℹ Use the conflicted package (<http://conflicted.r-lib.org/>) to force all conflicts to become errors
Rows: 3053 Columns: 14
── Column specification ────────────────────────────────────────────────────────
Delimiter: ","
chr  (4): state, county, region, metro_status
dbl (10): rural_urban_code, perc_complete_vac, tot_pop, votes_Trump, votes_B...

ℹ Use `spec()` to retrieve the full column specification for this data.
ℹ Specify the column types or set `show_col_types = FALSE` to quiet this message.
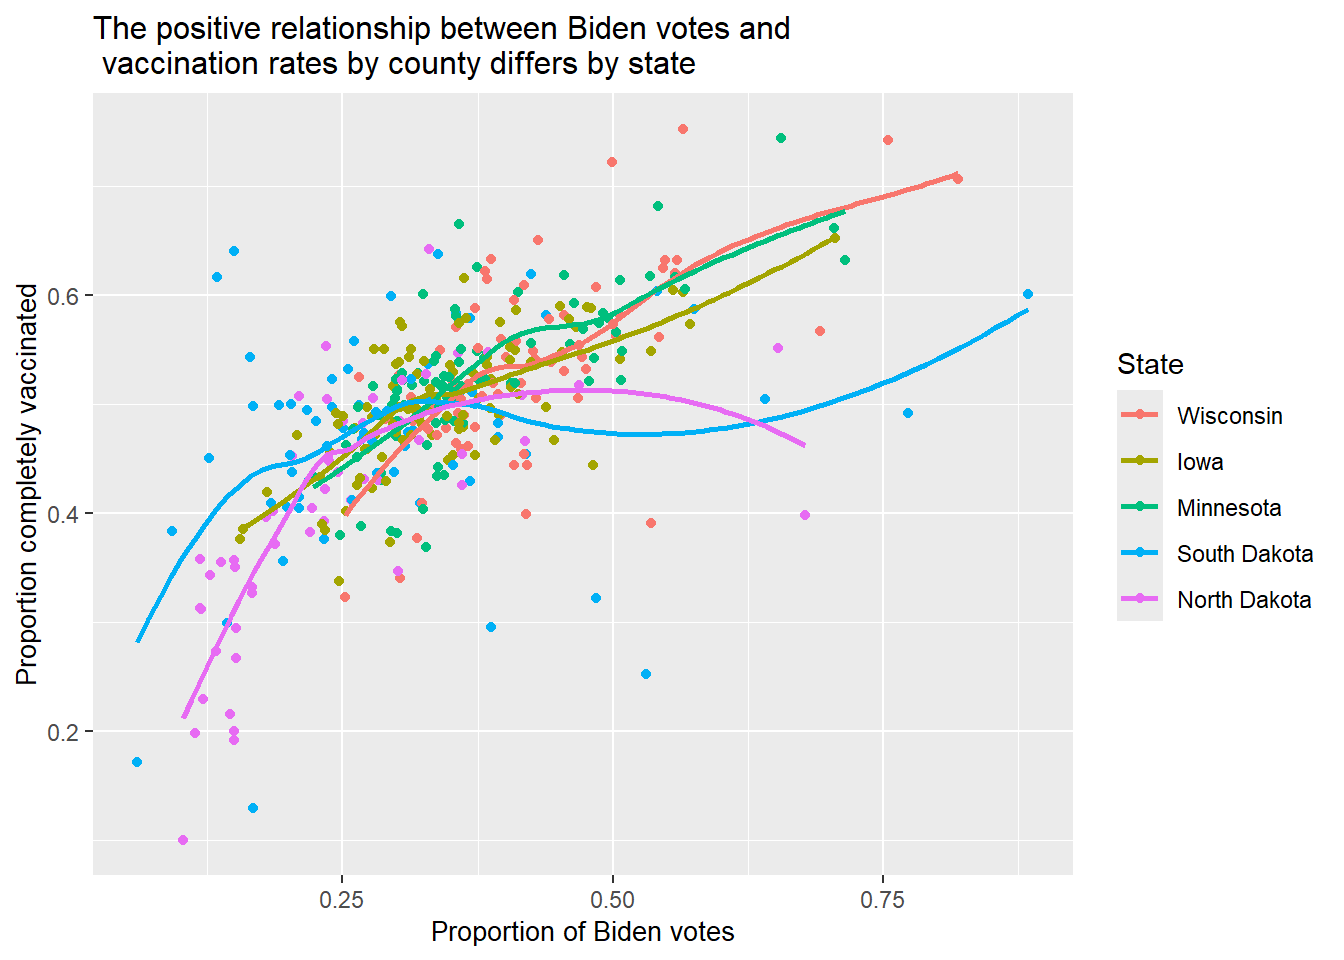
VACCINE.DATA |>filter(state %in%c("Minnesota","Iowa","Wisconsin","North Dakota","South Dakota")) |>mutate(state_ordered=fct_reorder2(state,perc_Biden,perc_complete_vac),prop_Biden=perc_Biden/100,prop_complete_vac=perc_complete_vac/100) |>ggplot(mapping =aes(x = prop_Biden, y = prop_complete_vac, color = state_ordered)) +geom_point() +geom_smooth(se =FALSE) +labs(color ="State", x ="Proportion of Biden votes",y ="Proportion completely vaccinated", title ="The positive relationship between Biden votes and \n vaccination rates by county differs by state") +theme(axis.title =element_text(size=10), plot.title =element_text(size=12))
`geom_smooth()` using method = 'loess' and formula = 'y ~ x'
Code comments
Please read Fostering Better Coding Practices for Data Scientists, which lays out a nice case for the importance of teaching good coding practices. In particular, their Top 10 List can help achieve the four Cs (correctness, clarity, containment, and consistency) that typify high-quality code:
Choose good names.
Follow a style guide consistently.
Create documents using tools that support reproducible workflows.
Select a coherent, minimal, yet powerful tool kit.
Rule 3: If you can’t write a clear comment, there may be a problem with the code.
Rule 4: Comments should dispel confusion, not cause it.
Rule 5: Explain unidiomatic code in comments.
Rule 6: Provide links to the original source of copied code.
Rule 7: Include links to external references where they will be most helpful.
Rule 8: Add comments when fixing bugs.
Rule 9: Use comments to mark incomplete implementations.
In your projects and homework for this course, we will look for good style and good commenting to optimize your abilities as a collaborating data scientist!